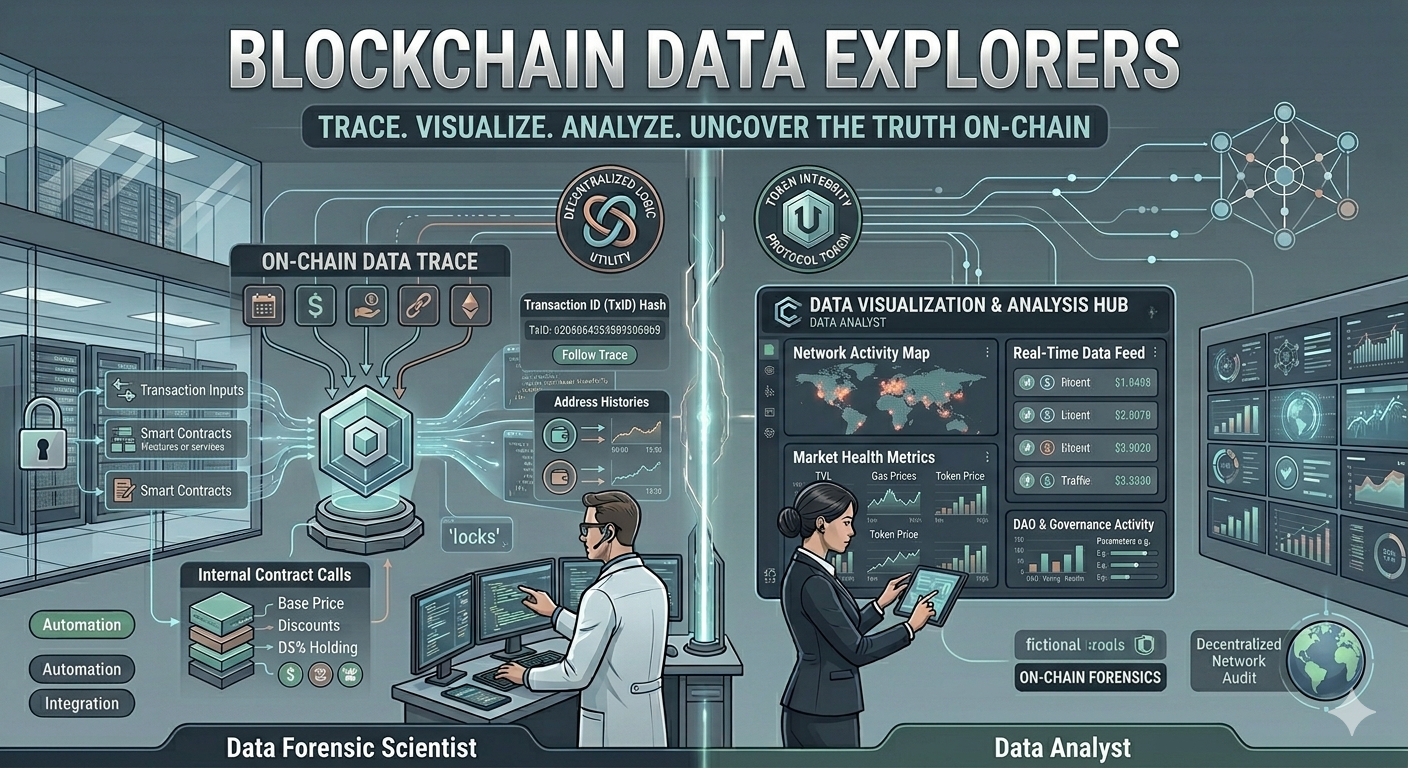
A detailed technical infographic, presented as a complex two-sided control panel, illustrates the comprehensive capabilities of Blockchain Data Explorers. The overall aesthetic is clean and structured, utilizing a professional color palette of slate grays, muted teals, clinical whites, and deep blues with subtle copper accents, suggesting a detailed enterprise blueprint or sophisticated software interface. The composition is split, subtly divided by a central, quiet vertical energy conduit. Across the top, massive, structured, silver-white and teal text headers read: Blockchain Data Explorers. Below this, a clean text banner reads: Trace. Visualize. Analyze. Uncover the Truth On-Chain.
The left side, labeled On-Chain Data Trace, features a complex branching data flow schematic. This section diagrammatically traces input data and smart contract calls (from sources like transaction inputs and internal contract logic, referencing prior system diagrams) to a central block icon. From this block, detailed data streams connect to specific analytical panels, including Transaction ID (TxID) Hash, showcasing detailed deep-dives, and Address Histories, visualizing wallet flow over time. Specialized forensic data forensic tools for internal contract calls are also included, with panels detailing parameters like Base Price, Discounts, and DS% Holding. A Data Forensic Scientist in a clean lab coat works at a multi-screen workbench, managing these complex data streams with specialized probes.
The right side, titled Data Visualization & Analysis Hub, focuses on presentation and macro metrics. Main panels within the dashboard view display key information such as a dynamic global Network Activity Map, a Real-Time Data Feed of transactions with clear icons and values, detailed Market Health Metrics with historical graphs for factors like Total Value Locked (TVL), gas prices, and token prices, and comprehensive charts for DAO & Governance Activity and parameter adjustments. Integrated logos for tools like Explorer Platform and Protocol Audit are present. Multiple figures, including a Data Analyst in sharp business attire, interact with the system via a large multi-touch wall screen. The background on both sides is a dense tapestry of flowing data network lines, connecting the control center to a stylized, distant, multi-node network diagram and data centers. Circular badges for Decentralized Logic and Token Integrity reinforce the system's focus on secure, precise, and tech-forward decentralized network status.
No specific requirements listed.